
On paper, the American economy is doing its job. Unemployment stood at 4.2% in September (Bureau of Labor Statistics, Oct. 2). The economy grew 2.2% in the second quarter (Bureau of Economic Analysis, Sept. 30). Jobs are being added, the stock market has made retirement accounts look healthy, and by the standards of the last half-century, none of that is bad news.
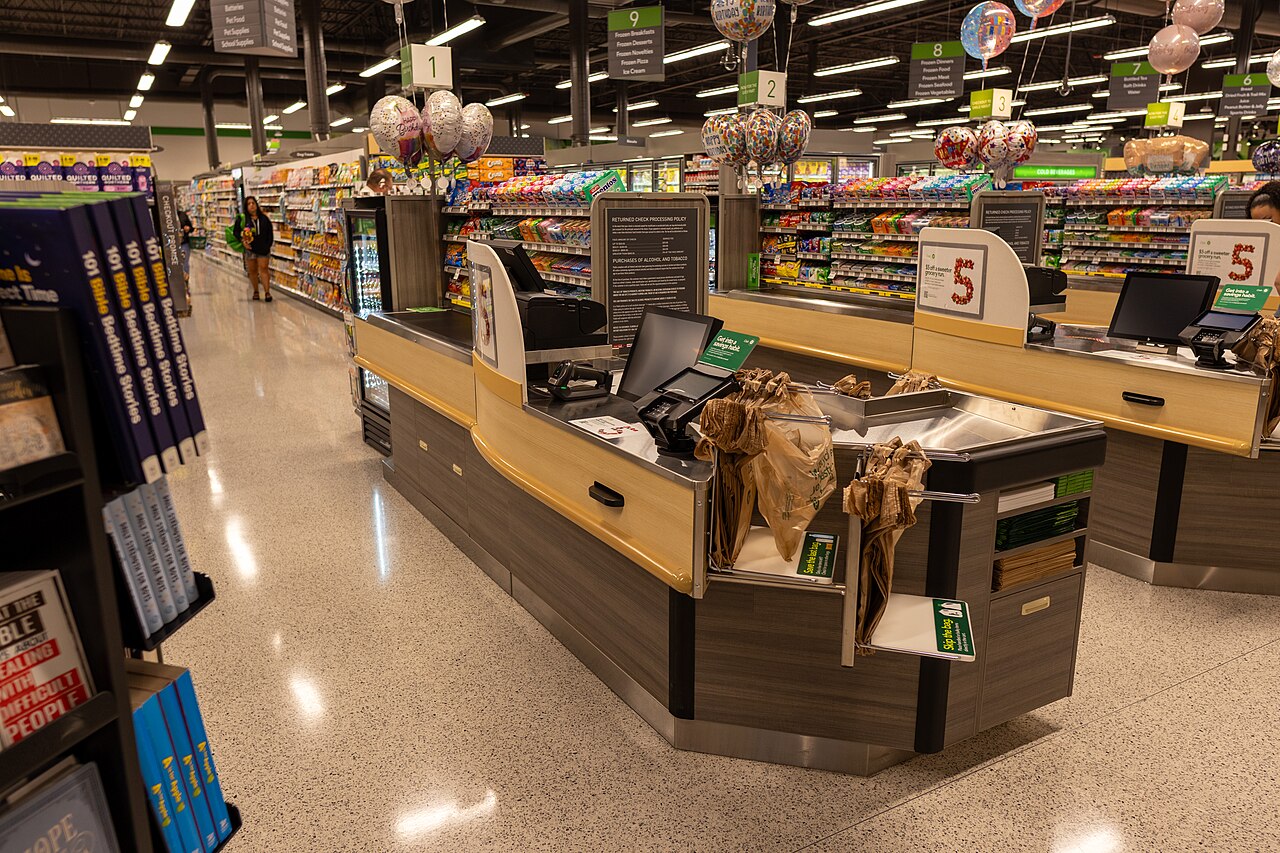
Now stand in the checkout line. Ground beef costs $6.79 a pound — up 46% since August 2021 and 68% since 2020. Coffee is up 44% in two years, to $9.33 a pound. Altogether, the same grocery cart that cost $100 in February 2020 costs about $132 today. A gallon of gas jumped 9.1% in September alone, up 34.2% on the year, after the war with Iran pushed oil to a $102 average for the month.
The Checkout, in Numbers
Beef at $6.79 a pound and coffee at $9.33 — the cart tells the story the averages smooth over.
Source: Bureau of Labor Statistics price data via NPR's grocery-price investigation, Oct. 20, 2026; BLS CPI, Sept. 2026.
That is the gap at the heart of American economic life in 2026: the official indicators describe a functioning economy, and the people living in it describe a squeeze. Both descriptions are accurate. They are just measuring different things.
Two economies, one country
Start with the part nobody argues about: Americans are gloomy at near-record levels. The University of Michigan's consumer sentiment index read 46.3 in early October — close to the lowest ever recorded in the survey's history — and its reading of current conditions hit an all-time low of 44.7. The Conference Board's confidence index fell to 81.9 in September, its lowest since 2014. Pew Research (Sept. 28–Oct. 4) found only 21% of Americans rate the economy excellent or good, while 42% call it poor. Three in four say they are very concerned about the price of gas and energy; 73% say the same about food.
The Federal Reserve's own household survey explains why. Only 63% of adults could cover a $400 emergency in cash — meaning 37% could not — and that figure has slid from 68% in 2021. The share saying they are doing okay or living comfortably has fallen from 78% to 73%.
The Household, in Numbers
The official gauges say growing. The household gauges — the ones people actually live by — say thinner ice every year.
Source: Federal Reserve, Economic Well-Being of U.S. Households (May 2026); Pew Research Center, Oct. 8 & Oct. 14, 2026.
Why the gap exists
The first reason is arithmetic. When officials say inflation has “cooled” — grocery inflation is currently just 1.8% a year — they mean prices are rising more slowly. They do not mean prices came back down. Households, reasonably, judge by the level: the cart costs $132, not $100. Harvard economist Stefanie Stantcheva's research finds people perceive inflation at roughly double the official rate, because they remember what things cost.
The second reason is new in 2026: this year the gap stopped being only about perception. In September, average wages grew 3.0% over the year while prices rose 3.7%. Adjusted for inflation, the typical paycheck shrank. “The economy is stagnant for the typical American household,” says Kyle Moore of the Century Foundation. Brookings' Darrell West puts it plainly: “Inflation is outstripping wage gains and people are having difficulty paying their bills.”
The third reason is the cost of borrowing and staying put. The Federal Reserve raised its benchmark rate in September — to 3.75–4.00%, its first hike since July 2023 — because inflation, at 3.7%, is running the wrong way. The average 30-year mortgage now stands at 7.40% (Freddie Mac, Oct. 15), the highest since November 2023. Meanwhile most existing homeowners hold mortgages under 6%, and nearly half of them say they are unwilling to sell and give that rate up. Economists call it the lock-in effect: houses don't turn over, young families can't buy, and the ladder stays pulled up.
The fourth reason is that the pain and the prosperity are unevenly shared. Card spending rose 6.2% in September (Bank of America Institute) even as sentiment cratered — households with investments feel the market's gains, while serious credit-card delinquency runs at 10.1% among borrowers aged 18–29 and has hit its worst level since 2011 among retirees. It is a K-shaped economy: one arm rising, one arm falling, and the averages describing neither.
And it is no longer a partisan story. It used to be that whichever party held the White House, the other side rated the economy terribly. That pattern still exists, but in 2026 the floor fell for everyone: Republican consumer sentiment is down 20% since January, independents down 22%. Joanne Hsu, who runs the Michigan survey, notes the frustration runs “across the political spectrum.”
The honest fine print
A few cautions belong on the record. Rent depends on who's measuring: Apartment List puts the national median at $1,388 and slightly falling, while Zillow's typical asking rent is $1,932 and rising — they count different homes, so the Daily won't pretend there's one number. “Paycheck to paycheck” has no official definition; 2026 surveys put it anywhere from 48% to 67%. And September's jobs gain of 29,000 comes with a margin of error so wide it is statistically close to zero.
Comments
From the readers of the Daily.